Edit chart
Loading graph
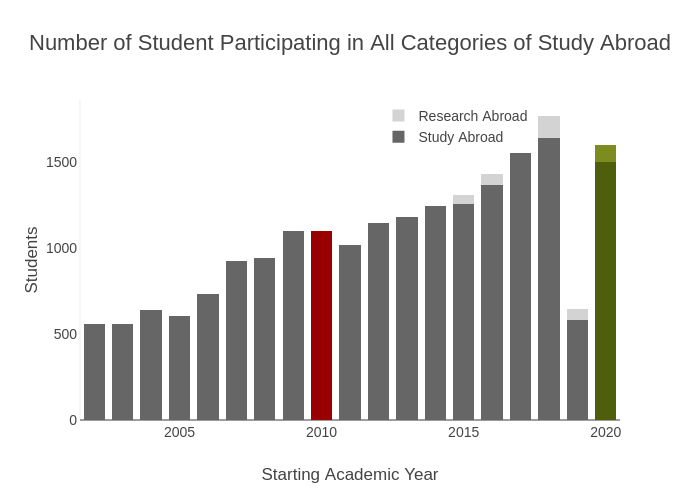
Provostncstate's interactive graph and data of "Number of Student Participating in All Categories of Study Abroad" is a stacked bar chart, showing Study Abroad, Baseline Students, y, Goal Study Abroad, Research Abroad, Goal, Research Abroad; with Starting Academic Year in the x-axis and Students in the y-axis.. The x-axis shows values from 2001.5 to 2020.5. The y-axis shows values from 0 to 1862.1052631578948. This visualization has the following annotation: Research Abroad tracking began in 2015; 2019-20 participation impacted by COVID